Athlete
To save the graph right-click on the image and select 'Save as...'.
About
The Lactate-OR web application implements various algorithms to compute blood lactate endurance markers. It is developed using R and RStudio's Shiny web framework.
How to use this application
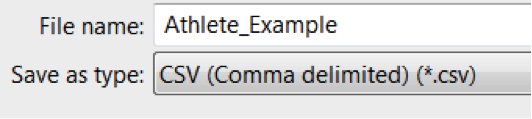
In order to use this web application, you will need to upload a CSV file where the first column contains workrate (either in in km/h or watts), a column containing blood lactate measurements and an (optional) column containing heart rate. A CSV file can be created in Excel using the 'Save as...' function and choosing CSV (comma-separated values) as the filetype.
The types of data that can be analysed are for:
- A single athlete with corresponding heart rate measurements for each blood lactate reading,
- Multiple blood lactate readings for a single athlete over time (a timeline), or
- Blood lactate readings for multiple athletes (a team).
Example files for each scenario are provided in the 'Example CSV file' link. Once the data is uploaded results are presented in the 'Summary' and 'Athlete/Athlete Timeline/Team' tabs. The 'Summary' tab displays a table with results from the following algorithms:
- Lactate threshold (LT)
- Lactate threshold based on log-log transforming the data (LT (log-log))
- 4 mmol marker (fixed blood lactate marker, FBLC)
- 1 mmol rise marker (Rise1mmol)
- Dmax
- D2LMax
The 'Athlete/Athlete Timeline/Team' tab shows the markers relative to graphs of the uploaded data. Each algorithm is presented in a tab. Additional controls are provided for the Rise1mmol and FBLC algorithms and are described in 'Controls' section below.
For a detailed description of each marker please refer to the following peer-reviewed article:
- Newell, John, et al. 'Software for calculating blood lactate endurance markers.' Journal of Sports Sciences. 25.12 (2007): 1403-1409.
- Simpkin, A. and Newell, J. (2013). An additive P-Spline approach to derivative estimation. Computational Statistics & Data Analysis, 68, 30-43. doi:10.1016/j.csda.2013.06.007
Controls
Additional controls are provided for two graph tabs: Rise1mmol and FBLC. Using these controls is straightforward: simply slide to select a value. Once a value is selected the marker values are recomputed and the graph is refreshed. If the selected values exceed the range of the data then no value will appear in the 'Summary' tab, an 'NA' is shown in the graph title and the value in the legend will be the lowest available value.
Saving results
The 'Download data' button saves the 'Summary' tab data as a CSV file. To save a plot right-click and select 'Save as...' from the context menu.
FAQs
- Why is the screen grayed out yet no error is displayed?
This could be due to a possible underlying bug that doesn't affect output. Try and refresh the screen. If this persists please send a bug report (see below). - Why do the marker estimates shown in the legend seem too small?
The data range is too small so the smallest value is shown instead. - Why don't I see a marker position (dashed vertical line) on the plot?
The data range is too small or too large to intersect the set of values provided. - How do I reset the screen?
You can simply refresh the screen (F5 on Windows/Linux; Cmd-R on the Mac). Alternatively, you can simply upload a new dataset. - How do I save the graph?
Please read the section titled 'Saving results'.
Authors
The original algorithms were implemented by John Newell. The final implementation into a Shiny app was done by Paul K Korir.
If you use this application please cite the following article:
- Newell, John, et al. 'App for the calculation of blood lactate markers.' Journal of Sports Sciences ahead-of-print (2014): 1-2.
Bug reports and feature requests
Please send these to paul [DOT] korir [HOSTED AT] orreco [DOT] com with the subject 'LACTATE-OR BUG' or 'LACTATE-OR FEATURE REQUEST'.
Athlete Timeline
To save the graph right-click on the image and select 'Save as...'.
About
The Lactate-OR web application implements various algorithms to compute blood lactate endurance markers. It is developed using R and RStudio's Shiny web framework.
How to use this application
In order to use this web application, you will need to upload a CSV file where the first column contains workrate (either in in km/h or watts), a column containing blood lactate measurements and an (optional) column containing heart rate. A CSV file can be created in Excel using the 'Save as...' function and choosing CSV (comma-separated values) as the filetype.
The types of data that can be analysed are for:
- A single athlete with corresponding heart rate measurements for each blood lactate reading,
- Multiple blood lactate readings for a single athlete over time (a timeline), or
- Blood lactate readings for multiple athletes (a team).
Example files for each scenario are provided in the 'Example CSV file' link. Once the data is uploaded results are presented in the 'Summary' and 'Athlete/Athlete Timeline/Team' tabs. The 'Summary' tab displays a table with results from the following algorithms:
- Lactate threshold (LT)
- Lactate threshold based on log-log transforming the data (LT (log-log))
- 4 mmol marker (fixed blood lactate marker, FBLC)
- 1 mmol rise marker (Rise1mmol)
- Dmax
- D2LMax
The 'Athlete/Athlete Timeline/Team' tab shows the markers relative to graphs of the uploaded data. Each algorithm is presented in a tab. Additional controls are provided for the Rise1mmol and FBLC algorithms and are described in 'Controls' section below.
For a detailed description of each marker please refer to the following peer-reviewed article:
- Newell, John, et al. 'Software for calculating blood lactate endurance markers.' Journal of Sports Sciences. 25.12 (2007): 1403-1409.
- Simpkin, A. and Newell, J. (2013). An additive P-Spline approach to derivative estimation. Computational Statistics & Data Analysis, 68, 30-43. doi:10.1016/j.csda.2013.06.007
Controls
Additional controls are provided for two graph tabs: Rise1mmol and FBLC. Using these controls is straightforward: simply slide to select a value. Once a value is selected the marker values are recomputed and the graph is refreshed. If the selected values exceed the range of the data then no value will appear in the 'Summary' tab, an 'NA' is shown in the graph title and the value in the legend will be the lowest available value.
Saving results
The 'Download data' button saves the 'Summary' tab data as a CSV file. To save a plot right-click and select 'Save as...' from the context menu.
FAQs
- Why is the screen grayed out yet no error is displayed?
This could be due to a possible underlying bug that doesn't affect output. Try and refresh the screen. If this persists please send a bug report (see below). - Why do the marker estimates shown in the legend seem too small?
The data range is too small so the smallest value is shown instead. - Why don't I see a marker position (dashed vertical line) on the plot?
The data range is too small or too large to intersect the set of values provided. - How do I reset the screen?
You can simply refresh the screen (F5 on Windows/Linux; Cmd-R on the Mac). Alternatively, you can simply upload a new dataset. - How do I save the graph?
Please read the section titled 'Saving results'.
Authors
The original algorithms were implemented by John Newell. The final implementation into a Shiny app was done by Paul K Korir.
If you use this application please cite the following article:
- Newell, John, et al. 'App for the calculation of blood lactate markers.' Journal of Sports Sciences ahead-of-print (2014): 1-2.
Bug reports and feature requests
Please send these to paul [DOT] korir [HOSTED AT] orreco [DOT] com with the subject 'LACTATE-OR BUG' or 'LACTATE-OR FEATURE REQUEST'.
Team*
To save the graph right-click on the image and select 'Save as...'.
About
The Lactate-OR web application implements various algorithms to compute blood lactate endurance markers. It is developed using R and RStudio's Shiny web framework.
How to use this application
In order to use this web application, you will need to upload a CSV file where the first column contains workrate (either in in km/h or watts), a column containing blood lactate measurements and an (optional) column containing heart rate. A CSV file can be created in Excel using the 'Save as...' function and choosing CSV (comma-separated values) as the filetype.
The types of data that can be analysed are for:
- A single athlete with corresponding heart rate measurements for each blood lactate reading,
- Multiple blood lactate readings for a single athlete over time (a timeline), or
- Blood lactate readings for multiple athletes (a team).
Example files for each scenario are provided in the 'Example CSV file' link. Once the data is uploaded results are presented in the 'Summary' and 'Athlete/Athlete Timeline/Team' tabs. The 'Summary' tab displays a table with results from the following algorithms:
- Lactate threshold (LT)
- Lactate threshold based on log-log transforming the data (LT (log-log))
- 4 mmol marker (fixed blood lactate marker, FBLC)
- 1 mmol rise marker (Rise1mmol)
- Dmax
- D2LMax
The 'Athlete/Athlete Timeline/Team' tab shows the markers relative to graphs of the uploaded data. Each algorithm is presented in a tab. Additional controls are provided for the Rise1mmol and FBLC algorithms and are described in 'Controls' section below.
For a detailed description of each marker please refer to the following peer-reviewed article:
- Newell, John, et al. 'Software for calculating blood lactate endurance markers.' Journal of Sports Sciences. 25.12 (2007): 1403-1409.
- Simpkin, A. and Newell, J. (2013). An additive P-Spline approach to derivative estimation. Computational Statistics & Data Analysis, 68, 30-43. doi:10.1016/j.csda.2013.06.007
Controls
Additional controls are provided for two graph tabs: Rise1mmol and FBLC. Using these controls is straightforward: simply slide to select a value. Once a value is selected the marker values are recomputed and the graph is refreshed. If the selected values exceed the range of the data then no value will appear in the 'Summary' tab, an 'NA' is shown in the graph title and the value in the legend will be the lowest available value.
Saving results
The 'Download data' button saves the 'Summary' tab data as a CSV file. To save a plot right-click and select 'Save as...' from the context menu.
FAQs
- Why is the screen grayed out yet no error is displayed?
This could be due to a possible underlying bug that doesn't affect output. Try and refresh the screen. If this persists please send a bug report (see below). - Why do the marker estimates shown in the legend seem too small?
The data range is too small so the smallest value is shown instead. - Why don't I see a marker position (dashed vertical line) on the plot?
The data range is too small or too large to intersect the set of values provided. - How do I reset the screen?
You can simply refresh the screen (F5 on Windows/Linux; Cmd-R on the Mac). Alternatively, you can simply upload a new dataset. - How do I save the graph?
Please read the section titled 'Saving results'.
Authors
The original algorithms were implemented by John Newell. The final implementation into a Shiny app was done by Paul K Korir.
If you use this application please cite the following article:
- Newell, John, et al. 'App for the calculation of blood lactate markers.' Journal of Sports Sciences ahead-of-print (2014): 1-2.
Bug reports and feature requests
Please send these to paul [DOT] korir [HOSTED AT] orreco [DOT] com with the subject 'LACTATE-OR BUG' or 'LACTATE-OR FEATURE REQUEST'.